Automate Excel File Using Python Pandas


Automating Excel workflows with Python makes data handling faster and more reliable, and automate excel file using pandas is one of the best ways to achieve this. Using python excel file automation, you can efficiently read, transform, and manage spreadsheets while performing excel data processing with pandas. This tutorial also covers excel data analysis using pandas and practical techniques to process excel files with python for real-world automation needs.
With just a few lines of code, you can read Excel files, modify data, merge sheets, and export updated reports automatically.Pandas offers built-in functions that are well documented in pandas official documentation.
What is Pandas in Python?
- Series: A one-dimentional labeled array
- DataFrame: A two-dimentional labeled table (like an Excel sheet or SQL table)
- If you’re working with tables. spreadsheet, or CSVs in Python – Pandas is your best frient
Why Use Pandas For Excel File Automation?
When you want to Automate Excel Files Using Pandas in Python For For efficient data handling, Pandas becomes one of the most powerful and practical tools available.
With python excel file automation , you can simplify excel file processing using python, reduce manual effort, and perform reliable excel data processing with pandas for both small and large datasets.
- First, you save time – Pandas processes thousands of rows in seconds instead of manual editing in Excel.
- Second, you reduce human errors – You write logic once and run it multiple times without mistakes.
- Next, you handle large data easily – Excel data processing with Pandas works smoothly even with big Excel files that slow down traditional Excel software.
- Then, you automate repetitive tasks – You can clean, filter, update, and format data automatically.
- Moreover, you reuse scripts anytime – A single script supports daily, weekly, or monthly excel file processing using python.
- In addition, you improve data processing speed – Pandas performs calculations and transformations faster than Excel formulas.
- Also, you combine multiple Excel files – You can merge, join, or append files easily using simple pandas functions.
- Finally, you scale your automation – You extend your script to connect with databases, APIs, or dashboards.
- Therefore , if you want fast,accurate and scalable workflows, choosing to automate excel file using pandas is far more effective than relying ony on manual excel work.
Setting Up Your Environment for Excel Automate Excel File Using Pandas
⚙️ Prerequisites
- Python installed (3.8+ recommended)
- Basic Python knowledge
- Excel file (.xlsx)
Install Required Libraries
pip install pandas openpyxl
- pandas → main library
- openpyxl → read/write Excel (.xlsx)
How to Read and Process Excel File Using Pandas.
📂 Sample Excel File Structure
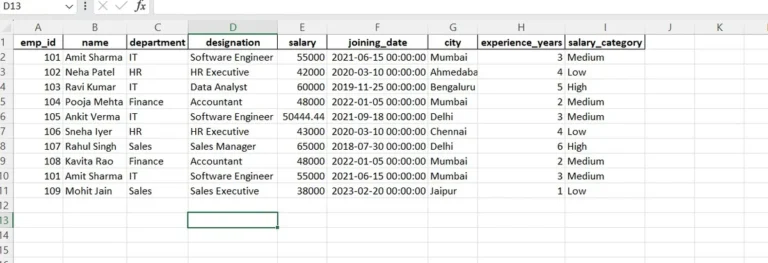
Example: employees.xlsx
| emp_id | name | department | designation | salary | joining_date | city | experience_years |
|---|---|---|---|---|---|---|---|
| 101 | Amit Sharma | IT | Software Engineer | 55000 | 2021-06-15 | Mumbai | 3 |
| 102 | Neha Patel | HR | HR Executive | 42000 | 2020-03-10 | Ahmedabad | 4 |
| 103 | Ravi Kumar | IT | Data Analyst | 60000 | 2019-11-25 | Bengaluru | 5 |
| 104 | Pooja Mehta | Finance | Accountant | 48000 | 2022-01-05 | Mumbai | 2 |
| 105 | Ankit Verma | IT | Software Engineer | 2021-09-18 | Delhi | 3 | |
| 106 | Sneha Iyer | HR | HR Executive | 43000 | 2020-03-10 | Chennai | 4 |
| 107 | Rahul Singh | Sales | Sales Manager | 65000 | 2018-07-30 | Delhi | 6 |
| 108 | Kavita Rao | Finance | Accountant | 48000 | 2022-01-05 | Mumbai | 2 |
| 101 | Amit Sharma | IT | Software Engineer | 55000 | 2021-06-15 | Mumbai | 3 |
| 119 | Mohit Jain | Sales | Sales Executive | 38000 | 2023-02-20 | Jaipur | 1 |
📥 Reading Excel File Using Pandas
					import pandas as pd
df = pd.read_excel("employees.xlsx")

print(df)
read_excel()reads Excel data.- Data is stored in a DataFrame.
print(df)displays data stored in DataFrame.
🧠View Summary Of Excel Data In Pandas
					# View basic information
df.info()
- First,
info()method in Pandas gives you a quick summary of your DataFrame. - It helps you understand the structure of your data before processing it.
					<class 'pandas.core.frame.DataFrame'>
RangeIndex: 10 entries, 0 to 9
Data columns (total 8 columns):
 #   Column            Non-Null Count  Dtype
---  ------            --------------  -----
 0   emp_id            10 non-null     int64
 1   name              10 non-null     object
 2   department        10 non-null     object
 3   designation       10 non-null     object
 4   salary            9 non-null      float64
 5   joining_date      10 non-null     datetime64[ns]
 6   city              10 non-null     object
 7   experience_years  10 non-null     int64
dtypes: datetime64[ns](1), float64(1), int64(2), object(4)
memory usage: 772.0+ bytes
Remove Duplicate
					# Remove duplicate rows
df = df.drop_duplicates()
print(df)
- Next,
drop_duplicates()removes repeated employee records to keep data accurate.
					      emp_id       name       department    designation     salary  joining_date   city     experience_years
0     101  Amit Sharma         IT  Software Engineer  55000.0   2021-06-15     Mumbai                 3
1     102   Neha Patel         HR       HR Executive  42000.0   2020-03-10  Ahmedabad                 4
2     103   Ravi Kumar         IT       Data Analyst  60000.0   2019-11-25  Bengaluru                 5
3     104  Pooja Mehta    Finance         Accountant  48000.0   2022-01-05     Mumbai                 2
4     105  Ankit Verma         IT  Software Engineer      NaN   2021-09-18      Delhi                 3
5     106   Sneha Iyer         HR       HR Executive  43000.0   2020-03-10    Chennai                 4
6     107  Rahul Singh      Sales      Sales Manager  65000.0   2018-07-30      Delhi                 6
7     108   Kavita Rao    Finance         Accountant  48000.0   2022-01-05     Mumbai                 2
9     109   Mohit Jain      Sales    Sales Executive  38000.0   2023-02-20     Jaipur                 1
Handling Missing Values
					# Handle missing salary values
df['salary'] = df['salary'].fillna(df['salary'].mean())
print(df)
- First, it checks for missing values (NaN) in the
salarycolumn. - Then, it calculates the average salary using
mean(). - Finally, it replaces missing salaries with the calculated average value.
					      emp_id       name       department    designation     salary  joining_date   city     experience_years
0     101  Amit Sharma         IT  Software Engineer  55000.0   2021-06-15     Mumbai                 3
1     102   Neha Patel         HR       HR Executive  42000.0   2020-03-10  Ahmedabad                 4
2     103   Ravi Kumar         IT       Data Analyst  60000.0   2019-11-25  Bengaluru                 5
3     104  Pooja Mehta    Finance         Accountant  48000.0   2022-01-05     Mumbai                 2
4     105  Ankit Verma         IT  Software Engineer 50444.44   2021-09-18      Delhi                 3
5     106   Sneha Iyer         HR       HR Executive  43000.0   2020-03-10    Chennai                 4
6     107  Rahul Singh      Sales      Sales Manager  65000.0   2018-07-30      Delhi                 6
7     108   Kavita Rao    Finance         Accountant  48000.0   2022-01-05     Mumbai                 2
9     109   Mohit Jain      Sales    Sales Executive  38000.0   2023-02-20     Jaipur                 1
Adding New Column Based On Salary In Pandas DataFrame
					# Add salary category column
df['salary_category'] = df['salary'].apply(
    lambda x: 'High' if x >= 60000 else 'Medium' if x >= 45000 else 'Low'
)
- First, it takes each
salaryvalue from the salary column. - Then, it checks the salary condition using a lambda function.
- Next, it assigns a category label based on the salary range.
- Finally, it creates a new column called
salary_category.
Result After Cleaning And Processing Excel File Using Python Pandas
- Data is duplicate-free.
- Missing values are handled.
- Columns are properly formatted.
- Dataset is ready for analysis, automation, and reporting.
🐍 Pandas Code to Save Processed Data Into Excel File
					# Save cleaned data to a newExcel file
df.to_excel(
    "cleaned_employee_data.xlsx",
    index=False,
    sheet_name="Cleaned_Employees"
)
- First,
to_excel()writes the cleaned DataFrame to an Excel file - Next, the file name
cleaned_employee_data.xlsxkeeps original and processed data separate. - Then,
index=Falseprevents Pandas from adding an unnecessary index column. - After that,
sheet_namegives a clear label to the worksheet for easy understanding. - Finally, the Excel file is ready for reporting, sharing, or further automation.
cleaned_employee_data.xlsx
📂 Read Multiple Excel Files Using Pandas
Import Required Libraries
					import pandas as pd
import os
-
First,
import pandasto handle Excel data. -
Then,
import osto access files in a folder.
Set Folder Path
folder_path = "sales_reports"
- Next, define the folder name where your Excel files are stored.
- Make sure all files are inside this folder.
Get All Excel Files
files = [file for file in os.listdir(folder_path) if file.endswith(".xlsx")]
- Then, list all Excel files from the folder.
- This step helps in process excel files with python automatically.
Read and Combine Files
					all_data = []

for file in files:
    df = pd.read_excel(os.path.join(folder_path, file))
    all_data.append(df)

final_df = pd.concat(all_data, ignore_index=True)
- First, create an empty list to store data.
- Then, read each Excel file one by one.
- Next, add each DataFrame to the list.
- Finally, combine all files into one DataFrame.
- This method improves excel file processing using python for bulk data.
Save Combined File
final_df.to_excel("combined_report.xlsx", index=False)
- Now, export the merged data into a new Excel file.
- You just completed python excel file automation for multiple files.
🚀 Complete Simple Script
					import pandas as pd
import os

folder_path = "sales_reports"

files = [file for file in os.listdir(folder_path) if file.endswith(".xlsx")]

all_data = []

for file in files:
    df = pd.read_excel(os.path.join(folder_path, file))
    all_data.append(df)

final_df = pd.concat(all_data, ignore_index=True)

final_df.to_excel("combined_report.xlsx", index=False)

print("All Excel files combined successfully!")
Analyzing Excel File For Automate Excel Reports Using Python Pandas
📂 Sample Excel Structure (sales_data.xlsx)
| Order_ID | Date | Region | Salesperson | Amount |
|---|---|---|---|---|
| 101 | 2026-01-01 | West | Rahul | 5000 |
| 102 | 2026-01-01 | East | Priya | NaN |
| 103 | 2026-01-02 | West | Amit | 7000 |
| 101 | 2026-01-01 | West | Rahul | 5000 |
You Need to:
🧹 Clean Messy Excel Data Using Pandas
- First, load the Excel file using Pandas to inspect incorrect formats, blank cells, and inconsistent values.
- Next, standardize column names and data types to ensure smooth Excel file processing using Python.
					import pandas as pd
from datetime import datetime

# 1️⃣ Load Excel file
df = pd.read_excel("sales_data.xlsx")
# 3️⃣ Convert Amount to numeric
df["Amount"] = pd.to_numeric(df["Amount"], errors="coerce")

# 5️⃣ Convert Date column to datetime
df["Date"] = pd.to_datetime(df["Date"])
- First,
pd.read_excel()is used to load the Excel file into Pandas so Python can process the data automatically. - Next,
pd.to_numeric()ensures the Amount column contains only numbers. - Meanwhile, invalid or empty values are safely converted to
NaNusingerrors="coerce". - Then,
pd.to_datetime()converts theDatecolumn into a proper date format.
♻️ Remove Duplicate Records from Excel File
-
Then, identify duplicate rows based on key columns like
Order_IDandDateto avoid double-counting sales. - As a result, the dataset becomes reliable for automated monthly sales reporting.
					# 2️⃣ Remove duplicate orders
df.drop_duplicates(subset=["Order_ID"], inplace=True)
- First,
drop_duplicates()is used to find and remove repeated order records from the Excel data. - Next, the
subset=["Order_ID"]ensures that each order appears only once in the dataset. - Meanwhile,
inplace=Trueupdates the original DataFrame without creating a new copy.
❓ Handle Missing Values in Excel Data
-
Meanwhile, detect missing sales amounts (
NaN) that can affect total calculations. - Therefore, fill or exclude these values using Pandas based on business logic to maintain data accuracy.
					# 4️⃣ Fill missing sales amount with average
df["Amount"].fillna(df["Amount"].mean(), inplace=True)

# 6️⃣ Add Month column
df["Month"] = df["Date"].dt.month
- First,
fillna()is used to replace missing sales values in the Amount column. - Next, the average (
mean) sales value is applied so the dataset remains balanced. - Then, a new
Monthcolumn is created from theDatecolumn using Pandas. - This helps group sales data by month for automated monthly sales reporting.
💰 Calculate Total Sales Using Pandas
- After cleaning, calculate the total sales amount using Pandas aggregation functions.
- This ensures accurate monthly revenue insights from automated Excel file analysis.
					# 8️⃣ Calculate total sales per salesperson
salesperson_summary = df.groupby("Salesperson")["Amount"].sum().reset_index()
- First,
groupby("Salesperson")groups the Excel data based on each salesperson. - Next,
sum()calculates the total sales amount for every salesperson. - Then,
reset_index()converts the result into a clean table format. - As a result, you get a clear summary showing individual sales performance.
🌍 Generate Region-Wise Sales Summary
- Additionally, group Excel data by region to analyze sales performance across different locations.
- This helps stakeholders quickly compare regional trends in the automated report.
					# 7️⃣ Calculate total sales per region
region_summary = df.groupby("Region")["Amount"].sum().reset_index()

# 9️⃣ Add report generation date
report_date = datetime.now().strftime("%Y-%m-%d")
- First,
groupby("Region")organizes the Excel data based on each region. - Next,
sum()calculates the total sales amount for every region. - After that,
datetime.now()captures the current date when the report is created. - Meanwhile,
strftime("%Y-%m-%d")formats the date in a clear and professional style. - Therefore, every automated Excel report shows when it was generated.
📊 Create a Professional Excel Report Automatically
- Finally, export cleaned data and summarized results into a structured Excel file using Pandas.
- Thus, you achieve a fully automated, professional monthly sales report without manual effort.
					# 🔟 Exports automate excel reports using python with multiple file
with pd.ExcelWriter("Monthly_Sales_Report.xlsx", engine="openpyxl") as writer:
    df.to_excel(writer, sheet_name="Cleaned_Data", index=False)
    region_summary.to_excel(writer, sheet_name="Region_Summary", index=False)
    salesperson_summary.to_excel(writer, sheet_name="Salesperson_Summary", index=False)
- First,
pd.ExcelWriter()is used to create a new Excel file automatically. - Next,
engine="openpyxl"allows Pandas to write multiple sheets in one Excel workbook. - Then, the cleaned Excel data is saved in a sheet named Cleaned_Data.
- After that, the region-wise sales summary is exported to Region_Summary.
- Finally, the salesperson-wise sales totals are saved in Salesperson_Summary.
🚀 Complete Automation Script For Automate Excel Reports Using Python
					import pandas as pd
from datetime import datetime

#  Load Excel file
df = pd.read_excel("sales_data.xlsx")
#  Convert Amount to numeric
df["Amount"] = pd.to_numeric(df["Amount"], errors="coerce")

#  Convert Date column to datetime
df["Date"] = pd.to_datetime(df["Date"])

#  Remove duplicate orders
df.drop_duplicates(subset=["Order_ID"], inplace=True)

#  Fill missing sales amount with average
df["Amount"].fillna(df["Amount"].mean(), inplace=True)

#  Add Month column
df["Month"] = df["Date"].dt.month

#  Calculate total sales per salesperson
salesperson_summary = df.groupby("Salesperson")["Amount"].sum().reset_index()

#  Calculate total sales per region
region_summary = df.groupby("Region")["Amount"].sum().reset_index()

#  Add report generation date
report_date = datetime.now().strftime("%Y-%m-%d")

#  Export to Excel with multiple sheets
with pd.ExcelWriter("Monthly_Sales_Report.xlsx", engine="openpyxl") as writer:
    df.to_excel(writer, sheet_name="Cleaned_Data", index=False)
    region_summary.to_excel(writer, sheet_name="Region_Summary", index=False)
    salesperson_summary.to_excel(writer, sheet_name="Salesperson_Summary", index=False)
❓ Frequently Asked Questions (FAQs)
How do I automate an Excel file using Pandas?
read_excel(), processing the data, and exporting results using to_excel(). This method allows full excel file processing using python without manual editing.